Outline data in Excel

Outlining data is a useful fuanction provided in Excel, which facilitate better organizing of data tables. It will also enable gropuing of simmilar data and collapsing.
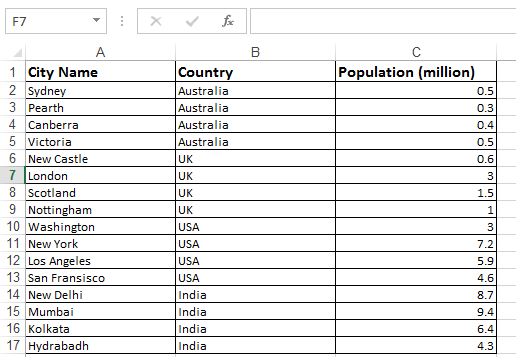
The importance and functionality of this excel function is better explained in the following example. Consider the following data set and suppose that you want to group the data based on the country.
-
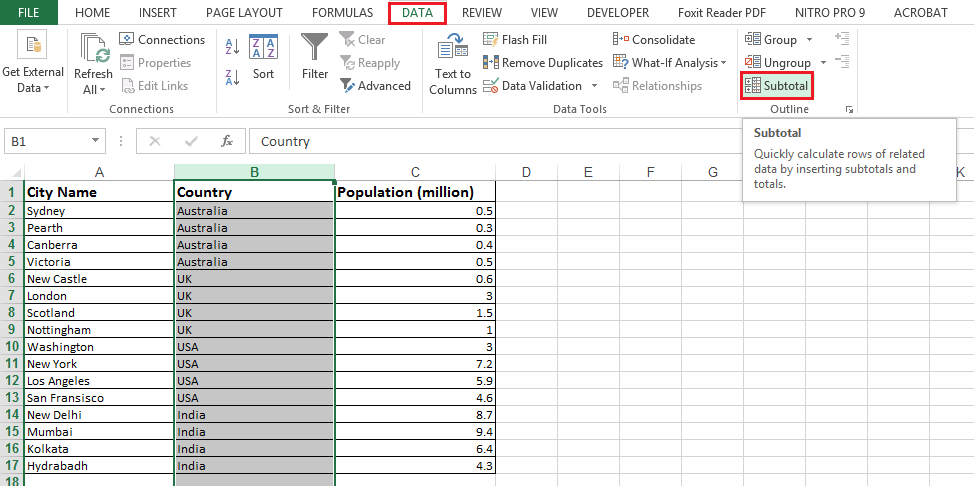
First select the column you want to outline and then sort it. So the similar items will appear together.
-
Then, again select the column > go to Data tab > Subtotal
-
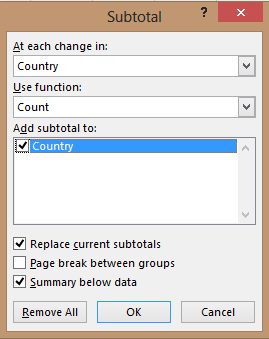
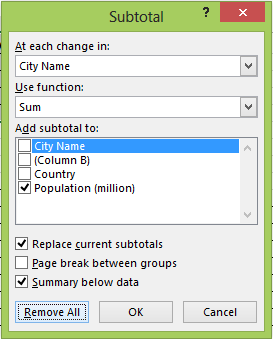
The following dialog box will open.
-
Select the “Country” column, ues “Count” function, tick the country check box > click OK
-
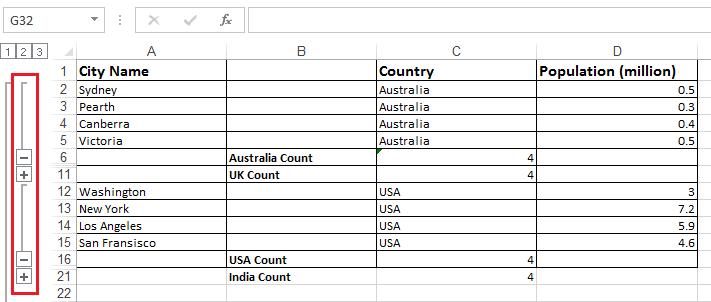
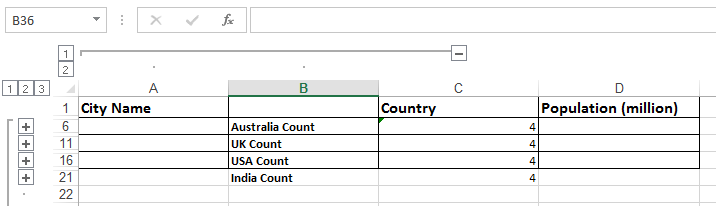
The outlined result would be as follows:
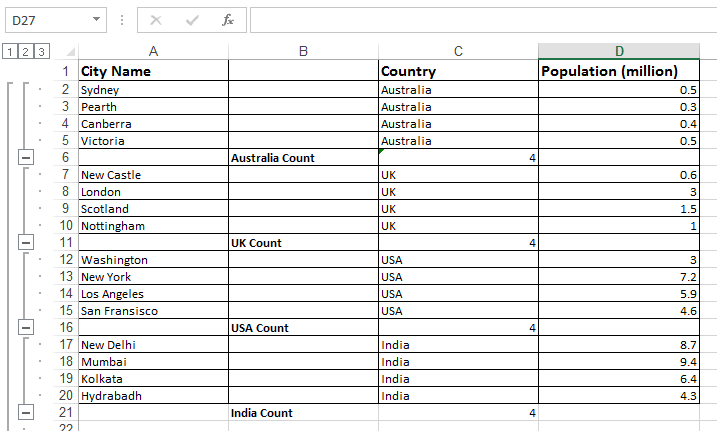
Note that, data has been grouped based on the country (i.e. the selected data column) and a sub-total is shown for each category.
The group of rows can be collapsed using the minus sign, which appear on the left hand side.
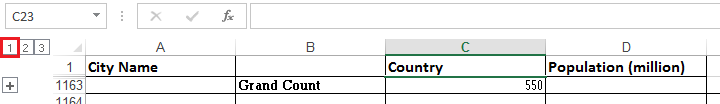
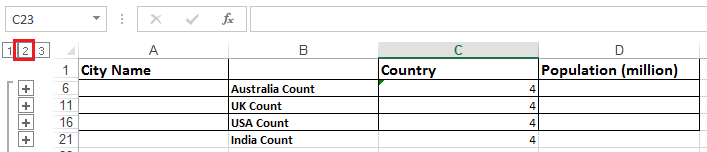
The numbers appear on the left hand side boxes are used display different data by the level:
-
Select 1 to show the grand total
-
Select 2 to show the count of each category
The columns can also be grouped. Select adjacent columns that you want to group and collapse.
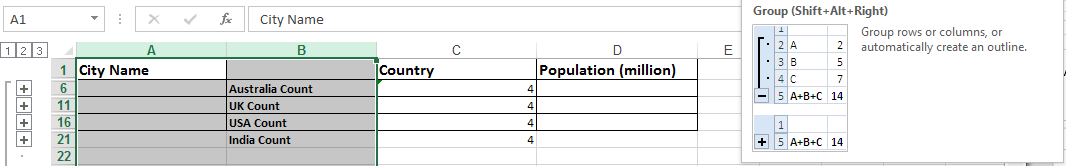
Now the levels/ groups of columns are appeared on the top as well.
If you want to remove data outline, select any cell within the data range > go to Data tab > Subtotal > Remove all
By using these available functions, you can outline data for organizing and easy representation.

Related Tutorials

The sorting facility is an important and highly useful feature provided in Excel. Which can be used to handle and retrieve data from large databases.

Excel does not only have the ability to handle small data but also very big data as well. Big data can be described as data that has a high variety, high velocity or h...
Vlookup can be considered as one of the most beneficial functions offered in Microsoft Excel, which has become much useful in data an...


Latest
-
Understanding How HYPERLINK Works In Excel
Excel has a built in function to create hyperlinks &...
-
Understanding how MS Excel Query Works
“Query” in MS Excel has same meaning as ...
-
An Introduction To Excel Power Map
Our today’s post is about “Power Map&rdq...
-
Using Pivot Charts For Displaying Data
Conventional charts are mostly used for displaying r...
-
Using “Calculated Items” For Analyzing A Pivot Table
In our last post, we explored how to use calculated ...